

Demand forecasting in flower logistics is a tool that enables companies to anticipate the volumes of fresh-cut flowers required in the coming weeks. For businesses involved in international supply chains and cold-chain operations, this means more than planning sales — it is about managing risks, inventory, and operational costs. The more accurate the forecast, the fewer write-offs, urgent shipments, and quality losses along the route from the plantation to the retail display.
What demand forecasting in flower logistics is and why it matters
Demand forecasting is a systematic assessment of future sales and consumption volumes, based on historical shipments, seasonality, weather conditions, and market signals. In international fresh-cut flower logistics, accurate forecasts help synchronize all links of the chain: plantations in Kenya and Ecuador, hubs in the Netherlands, and distribution centers in Russia or Europe. When a business relies on forecasts, it can plan procurement, transportation, and storage capacity without excessive buffers or urgent corrections.
How the specifics of the fresh-cut flower market affect forecast accuracy
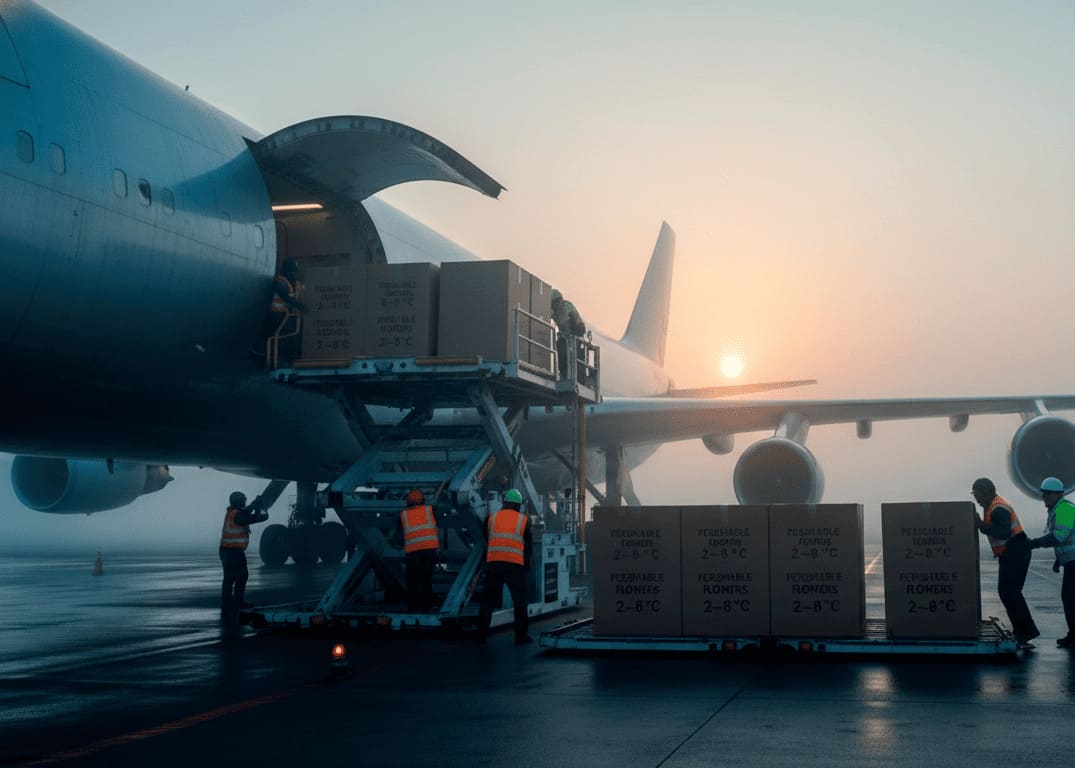
Flower logistics falls into the category of highly perishable products: each extra day in transit reduces vase life by 10–15%. Temperature, humidity and the speed at which cargo passes through “cold points” (from the plantation cooler to the hub, air transport, and the florist’s warehouse) directly affect product quality. Even a slight deviation of 2–3 °C from the expected temperature profile can shorten shelf life by two days. Therefore, forecasts must account not only for sales patterns but also the physical parameters of the cold chain — flight frequency, cooler occupancy, connection times and terminal throughput.
To achieve this, companies use WMS (Warehouse Management Systems), temperature sensors, and RFID tracking, which connect movement data with the actual condition of each shipment. This allows them to forecast not only demand but also the logistical ability to handle the required volume without compromising quality. Such models are especially important for shipments from Kenya and Ecuador, where weather fluctuations and flight delays occur more frequently.
How demand forecasts differ from procurement plans and S&OP
A demand forecast is a statistical model of a probable future, while a procurement plan or S&OP (Sales and Operations Planning) is a managerial decision built on that forecast. The forecast outlines the possible range of demand, while S&OP defines how the company will act: how much to order, which routes to activate, and where to store inventory. In flower logistics this balance is critical — overly conservative planning leads to shortages and urgent airfreight, whereas excessive planning results in write-offs and higher cooling costs.
Modern platforms allow companies to merge forecasts with actual shipment data and automatically recalculate plans when weather, demand, or route delays change.
How forecasting helps reduce costs
The primary benefit of forecasting for the flower industry is cost control. When a company can anticipate demand peaks, it can distribute volumes across warehouses and routes without spending on urgent replenishment or overtime labor. Forecasting also helps reduce excess inventory, stabilize delivery times, and improve margin predictability.
Losses during storage and transportation
According to industry reports, up to 20% of product cost is lost during storage and transport due to temperature deviations. Forecasting allows businesses to size each shipment to actual demand — reducing the time flowers spend in cold rooms and lowering energy consumption required to maintain the cold chain. For example, adjusting the forecast ahead of March 8 can reduce returns and disposal volumes by 10–15%.
Integrating the forecast with temperature-control systems and RFID tracking helps pinpoint where and when overheating or delays occurred, and use this information to optimize future routes. More details can be found in the article on RFID and temperature tracking.
Optimizing procurement and inventory
Excess orders in the flower industry quickly turn into frozen capital. Cold rooms and warehouses operate at full capacity, while part of the product loses its commercial appearance before reaching customers. Demand forecasting enables more accurate procurement volumes from growers in the Netherlands and Latin America, aligning shipments with real sales. This reduces the load on hubs and cuts the need for additional flights or temporary cooling facilities.
Even a 5% forecast deviation can mean hundreds of thousands of rubles in cost-to-revenue difference during peak seasons. For this reason, companies increasingly rely on ML models that factor in CRM data, online sales and previous seasons.
Planning logistics and staffing without “firefighting” overloads
With manual planning, seasonal peaks often result in overtime work and increased transport costs. Forecasting allows companies to allocate transport resources and staff shifts in advance. For instance, if the system indicates a 25% increase in demand toward February 14, the company can pre-book additional refrigerated transport and expand packaging-line capacity. This reduces the risk of disruptions and quality loss due to cold-chain overload.
Thanks to accurate forecasts, companies reduce the share of urgent airfreight, lowering transportation expenses by 10–12% compared with previous seasons. Another example of efficient route design can be found in the article on multimodal flower delivery.
Which factors shape demand for flowers
Sales volumes in the flower industry are influenced by dozens of variables — from holiday calendars and weather to online-channel activity. For precise forecasting it is important to consider not only historical data but also external signals that shift customer behavior at any given moment.
Seasonality and key peaks: February 14, March 8, Mother’s Day
The flower business follows its own calendar. During holidays such as February 14 and March 8, demand can increase five- to seven-fold, and any deviation in the forecast results in losses. International logistics must account not only for the peak itself but also the time lag between cutting and retail — usually 5–7 days. Incorrect allocation of batches across routes leads to excess inventory in some regions and shortages in others. Forecasting helps balance these flows and stabilize cold-chain utilization.
Weather and local events as unpredictable drivers
Weather has a direct impact on demand: prolonged cold spells reduce street and impulse purchases, while an early spring can increase sales by 20–30% compared with the previous year. Local festivals, weddings, and corporate orders create sharp demand spikes, especially in large cities. Factoring these elements into the forecast allows you to flexibly reroute shipments and maintain SLA (Service Level Agreement) performance even as external conditions change.
Promotions and discounts
Discounts and promotional campaigns influence customer behavior no less than seasonality. For example, a 10% price reduction on roses can increase sales by 15–20%, but this effect is short-lived and distorts future forecasts. Machine-learning algorithms capture these effects and “clean” the data to avoid overestimating demand in subsequent weeks. For flower logistics, this translates into more stable routes and balanced use of transport capacity, without chaotic spikes in shipments.
Where to source data for forecasts

Forecast accuracy always depends on data quality. In flower logistics this is especially evident: a single incorrect sales metric or a delay in CRM updates can cause the model to overestimate demand. To ensure the forecast reflects reality, companies must collect data from both internal systems and external sources — from weather reports to search trends.
Internal sources: sales, CRM, pre-orders, returns
The foundation of forecasting lies in data from your own sales, pre-orders, and returns. CRM systems capture the behavior of regular customers — flower shops, florists, and corporate buyers. These data points allow you to assess not only overall demand, but also specifics by region, variety, and stem length (SKU — stock keeping unit). Returns and write-offs highlight where the cold chain failed and how this impacted future procurement.
Integrating CRM with WMS (Warehouse Management System) provides end-to-end visibility: you can see which batches were delayed, where temperatures dropped, and which customers changed their order volumes. This makes it possible to align the forecast with actual flows rather than with averaged data.
External signals
External data helps capture hidden demand triggers. Weather conditions affect both transit times and buying decisions: a sudden cold snap reduces street sales, while early warming boosts impulse purchases. Search trends for phrases like “rose bouquet for March 8” or “flowers with delivery” signal an upcoming increase in e-commerce demand.
Holiday and local event calendars (Mother’s Day, graduations, corporate dates) enable companies to model peak scenarios in advance. Combining these inputs with historical sales helps avoid overloading the cold chain. In larger organizations, such external sources are integrated into a central analytics platform via API, where they are processed by ML models.
Data cleaning and adjustments: gaps, short shipments, price spikes
Even highly accurate models will not perform with “dirty” data. In flower logistics, incomplete sales reports, flight delays, and RFID scanning errors are common. Before training a model, the data must be cleaned: duplicates are removed, gaps are corrected, and days with emergency shipments or abnormal prices are excluded.
For example, if a shipment fails to arrive on time due to a flight disruption, demand for that day appears to be zero — even though it actually existed. Correcting such anomalies restores the reliability of the forecast. In some cases, “placeholder” values are used — estimates based on adjacent dates or similar SKUs — to preserve the seasonal pattern.
Forecasting methods and technologies
Forecasting tools in flower logistics fall into two categories: classical statistical methods and modern machine-learning models. Their goal is to identify patterns among sales, seasonality, weather, and customer behavior in order to build the most realistic scenario of future demand.
Basic models
Simple models are useful when data volume is limited. Moving averages help smooth short-term fluctuations, while exponential smoothing (such as Holt–Winters) accounts for trend and seasonality. These methods are well suited for local warehouses or narrow categories where demand patterns are relatively stable.
Their advantage lies in transparency and ease of interpretation. However, in the flower business, where weather and holiday timing change from year to year, simple models quickly lose accuracy — especially when forecasting more than 2–3 weeks ahead.
Machine learning and neural networks
Machine-learning (ML) models and neural networks allow you to account for dozens of factors simultaneously. Meta’s Prophet performs well with incomplete time series and reveals hidden seasonal effects. LSTM networks (Long Short-Term Memory) are trained on long historical sequences and capture complex dependencies among weather, promotions, and customer behavior.
Ensemble models that combine statistical and ML approaches deliver the best results under volatile demand conditions. They automatically update forecasts as new data arrive, which is particularly important in international flower shipments, where weather changes in Ecuador or Kenya can reshape order structures within a few days.
Hierarchical forecasts for different levels of the supply chain
Flower logistics spans several levels: plantation, export hub, airfreight, distribution warehouse, and retail. Hierarchical forecasting consolidates data from all these levels into a single model — from total volumes by variety down to a specific SKU in a store. This approach helps synchronize orders between countries and prevent inconsistencies in planning.
For example, if the forecast for the “Red Naomi” rose variety in Europe increases by 10%, the system automatically adjusts procurement at plantations and allocation across warehouses. This improves accuracy across the entire chain and reduces the risk of overstock.
How to evaluate and improve forecast accuracy
Even the most advanced model requires continuous monitoring. In flower logistics, forecast accuracy directly affects financial performance: every deviation increases write-offs and reduces service levels. Companies therefore use a set of metrics and procedures to measure model quality and adjust it in real time.
MAPE, bias, fill rate — and how to use them
MAPE (Mean Absolute Percentage Error) indicates the average forecast error as a percentage. For the flower industry, an acceptable level is up to 10–15% on a weekly horizon. Bias measures systematic deviation: a positive value indicates demand overestimation, while a negative value indicates underestimation. Fill rate shows what proportion of orders was delivered on time and serves as a practical measure of forecast accuracy for logistics.
Combining these metrics allows you not only to evaluate model quality but also to pinpoint specific causes of deviations — for example, incorrect temperature data or shipment delays. According to industry reports, regular metric audits reduce storage and transportation costs by 5–8% during the first year after implementation.
Peak-week control and human-in-the-loop
During peak periods — February 14, March 8, the New Year weeks — even a highly accurate model requires human adjustment. The human-in-the-loop approach combines automated forecasting with expert review by logisticians and buyers. Specialists adjust model outputs based on local events, flight delays, and warehouse conditions.
This hybrid format reduces the risk of disruptions and strengthens cold-chain reliability. At the same time, the system keeps a full change history, which can later be used to further train the model and improve its accuracy.
Scenario planning
Scenario-based planning helps businesses prepare for uncertainty. Instead of a single figure, the model produces three variants: a baseline scenario (expected demand), an optimistic scenario (growth driven by promotions or weather), and a stress scenario (demand decline or supply delays). This makes it possible to plan inventory levels, routes, and transport schedules in advance.
In international flower logistics, scenario planning enables companies to redistribute flows between countries. For example, if a cold spring is forecast in Europe and a warm one in Asia, part of the export volume from the Netherlands can be redirected eastward. This approach reduces the risk of excess stock and stabilizes margins at a global level.
Historical context

Until the mid-2010s, supply planning in the flower industry remained largely intuition-driven. Experienced logisticians and buyers estimated future demand from memory — relying on last year’s dates, conversations with customers, and personal judgment. With limited data volumes and stable routes, this approach still worked. But as international shipments expanded, varieties diversified, and cold-chain turnover accelerated, its effectiveness declined.
Why manual planning no longer works
Modern flower logistics operates across hundreds of SKUs, dozens of lanes, and highly dynamic delivery times. Even a small error in demand estimation triggers a chain reaction: overloaded hubs, congested cold rooms, excess procurement, and write-offs. Manual planning cannot adequately factor in the impact of weather, exchange rates, promotions, and local events — variables that today drive up to 60% of demand volatility.
Human perception also struggles with nonlinear data. For example, online order growth is uneven: a peak week may be followed by a sharp dip, which confuses even seasoned specialists. Automated models handle this task more accurately and quickly, updating forecasts whenever input parameters change.
How logistics digitalization transformed the supply chain
The digital transformation of the industry began with the implementation of WMS and ERP systems, which made it possible to consolidate data on shipments, storage, and sales in a single environment. This was followed by temperature sensors, RFID tags, and platforms for real-time cold-chain monitoring. These technologies turned every batch of flowers into a data source — with coordinates, internal pulp temperature, and remaining shelf life.
As SaaS solutions evolved, forecasting became part of day-to-day operations. Systems automatically collect information from plantations, airports, and distribution centers, generating demand forecasts based on thousands of factors. This has improved accuracy, reduced workload for staff, and created a foundation for resilient international supply chains. More details on these approaches can be found in the article on SaaS models in logistics.
Engineering trade-offs and the cost of accuracy
Any forecasting system operates within a set of trade-offs: between accuracy and robustness, speed and reliability. The more detailed the model, the higher the computational cost and the greater the risk of overfitting. In flower logistics, the goal is not to achieve perfect accuracy, but to maintain a balance between reducing write-offs and avoiding stockouts.
The trade-off between minimizing write-offs and the risk of out-of-stock
A model that intentionally “tightens” order volumes to reduce costs does decrease excess inventory, but it also raises the risk of out-of-stock — the absence of essential assortments on the shelf. A lost sale on a peak holiday is more expensive than disposing of a few extra boxes. For this reason, companies often choose moderate inventory levels, sacrificing a portion of turnover to maintain service stability and SLA (Service Level Agreement) performance.
The optimal solution is to use range-based forecasts: the model provides a baseline, optimistic, and stress scenario. This allows logistics teams to determine in advance where to add buffer capacity and where savings are realistic.
Data scarcity and model overfitting
The flower industry frequently deals with incomplete data: different suppliers maintain records using their own formats, and parts of transactions may not be digitized at all. For machine-learning models, this poses a serious challenge — insufficient data leads to overfitting, where the model “remembers” past events but loses the ability to generalize. As a result, the forecast becomes overly sensitive to rare fluctuations.
To avoid this pitfall, companies use ensemble methods and data regularization — artificially “enriching” the dataset with similar SKUs and historical shipments from other countries. This approach makes the forecast more resilient, even when statistics are limited.
Global forecasting practices in flower logistics
In recent years, demand forecasting has become a standard capability for most international flower logistics operators. Analytical systems consolidate data from plantations, export hubs, and distribution centers to balance volumes and minimize losses along the cold chain. This approach ensures predictability even during seasonal peaks and unstable weather conditions.
How forecasting helps reduce write-offs during seasonal peaks
Ahead of major holidays — February 14, March 8, Mother’s Day — companies build scenario-based forecasts that account for past sales, weather patterns, and retail network activity. According to industry reports, such models reduce write-offs by 10–15% and enable more accurate planning of cold-room capacity. The effect is especially significant for shipments from regions with variable climates such as Kenya or Colombia.
The impact of forecasting on logistics
Accurate forecasts help reduce the number of urgent airfreight shipments and shift part of the volumes to multimodal routes. This lowers transportation costs and the carbon footprint, while stabilizing delivery schedules. In Europe and Asia, logistics operators report an 8–12% reduction in unplanned shipments after implementing forecasting systems. More predictable routes help maintain product quality and uphold SLA levels even during high-demand periods.
How to start using forecasting in your company
Implementing forecasting systems does not require an immediate transition to complex neural networks. It is important to begin with a basic level — collecting clean data and testing the model on a single category or region. This pilot helps assess accuracy and identify which parameters most influence errors.
Minimum dataset
The first step is consolidating sales, returns, and logistics reports into a unified format. Next, select a category with stable demand — for example, medium-stem roses. A basic model (such as a moving average or Prophet) is built on this dataset, followed by a comparison with actual results. Even this simple step provides insight into seasonal fluctuations and bottlenecks in the supply chain.
Scaling
After a successful pilot, forecasting can be integrated with procurement, WMS, and BI panels. This enables automated inventory recalculations and dynamic adjustment of transport routes. The next stage involves consolidating all data into a centralized repository, where ML models analyze them alongside weather, promotions, and logistics delays.
Progressive implementation gives companies operational control: forecasting becomes part of everyday decision-making rather than an occasional analytical task. This approach strengthens the resilience of the international supply chain and reduces costs over the long term.
