
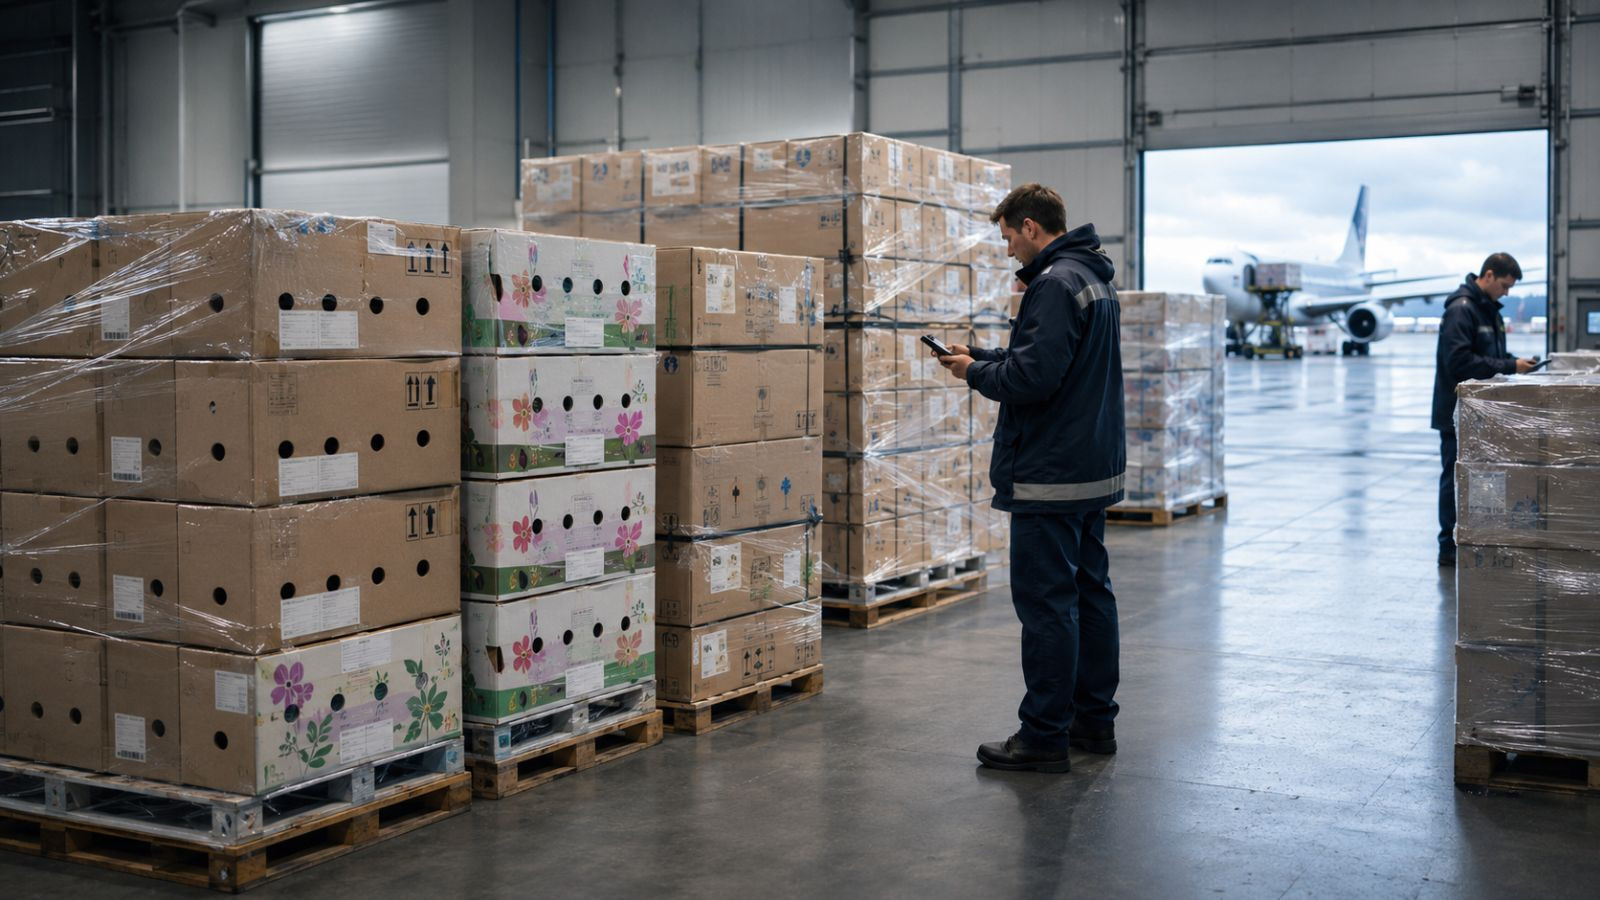
In 2023, the combined value of national gross exports of fresh cut flowers reported in WITS reached nearly $9.8 billion. Approximately 87.5% of this total was accounted for by five countries, with the Netherlands ranking first. However, this is not a ranking of global production: export statistics include goods crossing national borders, including imported consignments that are subsequently resold. This is why the list includes the industry's primary trade and logistics hub alongside major producing exporters such as Colombia, Ecuador, Kenya, and Ethiopia.
The ranking reflects four sources of competitiveness: scale, specialization, proximity to the customer, and distribution speed.
How the ranking was compiled
The ranking is based on 2023 data from World Bank WITS / UN Comtrade for code 060310 under HS 1988/92 (H0), covering "fresh cut flowers and flower buds." The broader HS 0603 category was not used because, according to the UN classification, it also includes dried and otherwise prepared flowers.
The comparable total of $9.791 billion was calculated by adding the national WITS entries without the EU aggregate, thereby avoiding double counting exports from individual member states. Data for 2024 were not included because Ethiopia and several other reporting countries are not yet available in WITS.
Global market · 2023
Which countries shape cut flower exports
The market is concentrated around the trading hub in the Netherlands and production clusters in Latin America and East Africa. Below is the estimated global total based on national entries, together with the ten largest countries in this dataset.
WITS/UN Comtrade, code 060310 H0, 2023; gross export value.
Relative scale of exports
Bar width is calculated relative to the Netherlands
| Rank | Country | Exports, $ million | Share |
|---|---|---|---|
| 1 | Netherlands | 4,646.7 | 47.46% |
| 2 | Colombia | 2,061.0 | 21.05% |
| 3 | Ecuador | 965.8 | 9.86% |
| 4 | Kenya | 660.8 | 6.75% |
| 5 | Ethiopia | 231.2 | 2.36% |
| 6 | China | 134.9 | 1.38% |
| 7 | Italy | 115.0 | 1.17% |
| 8 | Canada | 108.8 | 1.11% |
| 9 | Malaysia | 72.5 | 0.74% |
| 10 | Vietnam | 71.7 | 0.73% |
The five largest exporters
1. The Netherlands: infrastructure matters more than growing area
Dutch exports totaled $4.647 billion, or 47.46% of the comparable total. This result cannot be explained by domestic production alone. The country produces flowers, imports them from East Africa and Latin America, grades and consolidates consignments, organizes sales, and distributes products throughout Europe.
Royal FloraHolland is at the center of this system. According to the cooperative's annual report, products worth €5.346 billion passed through its marketplaces in 2024. This figure represents the turnover of the trading system, not Dutch customs exports, so the two figures cannot be compared directly. To understand the Dutch advantage, the structure of the system itself is more important: Royal FloraHolland integrates auction clocks, direct transactions, settlement, quality control, and logistics.
The model is evolving with the market. In 2024, the cooperative's direct channel volume increased by 2%, while auction clock sales volume declined by 5%. Flowers and plants worth €2.8 billion were traded through the Floriday digital platform, which handled 92% of Royal FloraHolland's direct trade.
Schiphol receives flowers from Africa and South America and connects air cargo flows with the Aalsmeer cluster. The airport identifies flowers as one of its principal perishable cargo categories: approximately 22% of its imports consist of flowers. After customs clearance, sale, and consolidation, consignments are transported to buyers in Germany, the United Kingdom, France, and other European countries. Russia was another significant destination in 2023: according to Dutch data in WITS, exports of fresh cut flowers to the Russian market totaled $242.0 million, or approximately 5.2% of Dutch exports under code 060310. Royal FloraHolland describes a network of approximately 200 international road carriers serving buyers on its platform.
The Netherlands is therefore more accurately described not as the largest producer, but as the largest export and distribution hub. The precise share of re-exports within category 060310 could not be established from the sources used. Broader CBS statistics for "flowers and plants" likewise do not support applying commonly cited estimates of 75–80% to fresh cut flowers.
2. Colombia: scale and a direct corridor to the customer
Colombia exported $2.061 billion worth of fresh cut flowers. The United States accounted for $1.648 billion, nearly 80% of the country's total. Canada, the United Kingdom, the Netherlands, and Japan were considerably smaller destinations.
Production is concentrated primarily in the Bogotá savanna and Antioquia. Seasonal shipments prominently feature roses, carnations, chrysanthemums, hydrangeas, and alstroemerias. Scale enables growers and exporters to assemble large, uniform consignments for retail chains and wholesale buyers, while the proximity of production areas to airports reduces the time from cutting to departure.
The primary corridor runs through El Dorado International Airport in Bogotá to Miami, where flowers are distributed throughout the United States. Miami International Airport handles 91% of U.S. flower imports transported by air, with Colombia and Ecuador together accounting for approximately 86% of these shipments. Volumes rise sharply before Valentine's Day and Mother's Day, making cargo capacity and the speed of phytosanitary clearance integral components of cost.
Air freight remains the primary mode, but ocean transport has already established a commercial niche. According to ProColombia, 92% of flower volume was shipped by air in January and February 2024, while 8% was transported by sea. This is a seasonal rather than annual share, but it demonstrates that suitable cultivars and regular supply programs are gaining an alternative to air freight.
3. Ecuador: high-altitude roses and broader market reach
Ecuador ranks third, with exports of $965.8 million and a 9.86% share. The United States remains its primary market, but accounts for approximately one-third rather than four-fifths, as in Colombia's case. Kazakhstan, the Netherlands, Italy, and Canada follow. This geographic spread makes the model more diversified, although it also complicates route planning.
Ecuador is known for its high-altitude roses. Production in Pichincha and Cotopaxi benefits from the combination of elevation, cool nights, and intense sunlight, conditions the industry associates with long stems and large flower heads. Roses dominate the product mix, but the country also supplies gypsophila and other summer flowers.
National statistics help indicate the physical scale of the industry, but use a broader category. Banco Central del Ecuador reported 180,900 metric tons and $987.1 million in "natural flowers" for 2023. Ecuador's shipment weight is not published in the global WITS entry for 060310.
The main long-haul channel is air freight from Quito Airport. Holiday peaks are as critical here as they are in Colombia: Pro Ecuador reported that during the 2024 Valentine's Day season, 1,942 metric tons of flowers were shipped through the cargo terminal on 31 flights.
Colombia and Ecuador: two Latin American models
| Parameter | Colombia | Ecuador |
|---|---|---|
| Exports under 060310 in 2023 | $2.061 billion | $965.8 million |
| Product range | Broad portfolio of species and cultivars | Specialization in high-altitude roses |
| Primary market | United States, approximately 80% | United States, approximately 34% |
| Other markets | Canada, United Kingdom, Netherlands, Japan | Kazakhstan, Netherlands, Italy, Canada |
| Growing conditions | High-altitude clusters in the Bogotá savanna and Antioquia | Highlands of Pichincha and Cotopaxi |
| Primary route | Bogotá → Miami → U.S. market | Quito → United States, Europe, and other long-haul markets |
| Advantage | Scale, product range, large-volume programs | Specialization in high-altitude roses and market diversification |
| Risk | Dependence on the United States and peak-period air cargo capacity | Cost of complex long-haul logistics |
4. Kenya: Africa's leading exporter between the hub and other markets
Kenya exported $660.8 million worth of fresh cut flowers. The Netherlands received $271.8 million, while the United Kingdom accounted for $114.4 million. Saudi Arabia, Kazakhstan, and the UAE also ranked among the five leading destinations. The Dutch hub remains the principal market, although a significant share of shipments is also directed elsewhere.
Roses are the main crop, with the principal production areas located around Lake Naivasha and in other high-altitude regions of Central Kenya. Flowers are transported to Nairobi Airport and then shipped to Europe and the Middle East. For each consignment, flight duration is not the only critical factor: delays between the farm, cooling facilities, terminal handling, and aircraft loading reduce the remaining shelf life and sales window.
Kenyan national statistics and international trade data differ. WITS reports 179,500 metric tons for 2023, while the official AFA Yearbook records 116,300 metric tons and 73.45 billion Kenyan shillings. The discrepancy may reflect differences in product coverage and the way trade flows are recorded, but the available sources do not allow the figures to be reconciled using a single conversion factor. WITS is therefore used for cross-country comparison, while the discrepancy remains unresolved.
In 2024, the industry faced a shortage of cargo capacity at JKIA and stricter EU requirements. From May 1, 2024, the minimum frequency of physical checks on roses from Kenya was set at 25%; the version effective from June 2026 retains this rate.
5. Ethiopia: its own air cargo hub and dependence on a single market
Ethiopia completes the top five with exports of $231.2 million. The Netherlands received $175.1 million, or approximately 75.7% of the country's exports. Saudi Arabia and the United Kingdom were considerably smaller destinations. This concentration simplifies management of the primary route but makes growers sensitive to conditions in the European market and the Dutch sales system.
Flower production clusters are located around Addis Ababa, Holeta, Bishoftu, and Ziway. Roses form the core of the product range; national statistics also record gypsophila and other fresh flowers separately. Ethiopia's important distinction is the integration of production with Ethiopian Cargo. The hub at Bole Airport includes a perishable cargo terminal with a designed annual capacity of 336,000 metric tons and temperature-controlled areas, according to Ethiopian Cargo.
The presence of a major national cargo carrier and dedicated cold-chain infrastructure supports the export supply chain. However, aircraft and terminals require high utilization, while the concentration of shipments through the Netherlands limits commercial diversification. As with Kenyan roses, the EU maintains a minimum physical inspection frequency of 25% for Ethiopian roses.
Ethiopia does not appear on the WITS page for 2024. This indicates the absence of a comparable reporter entry, not zero exports: quarterly reports from the Ethiopian Statistics Service confirm that shipments continued. The verified 2023 figure therefore cannot be replaced in the main ranking with an estimate for 2024.
Kenya and Ethiopia: different levels of dependence on Europe
| Parameter | Kenya | Ethiopia |
|---|---|---|
| Exports under 060310 in 2023 | $660.8 million | $231.2 million |
| Production base | Naivasha and other areas of Central Kenya | Clusters around Addis Ababa, Holeta, Bishoftu, and Ziway |
| Main product range | Roses | Roses, gypsophila, and other flowers |
| Primary markets | Netherlands, United Kingdom, Gulf countries, Kazakhstan | Netherlands, Saudi Arabia, United Kingdom |
| Share of the Netherlands | Approximately 41.1% | Approximately 75.7% |
| Air cargo hub | Nairobi / JKIA | Addis Ababa / Bole |
| Carriers | Several international cargo operators | Strong role of Ethiopian Cargo |
| Advantage | Greater scale and broader geographic reach | Dedicated cargo and cold-chain infrastructure |
| Primary risk | Air cargo capacity shortages and phytosanitary delays | Concentration on the Dutch channel and infrastructure dependence |
Ranks six through ten
6. China: Asian exports centered on Yunnan
China exported $134.9 million worth of fresh cut flowers. Japan, the Republic of Korea, and Thailand form the core of demand, with Chinese exports concentrated primarily within Asia.
Yunnan is the principal production cluster. Provincial authorities reported fresh flower exports of 570 million yuan in 2023 and identified roses, lilies, carnations, gerberas, lisianthus, and chrysanthemums among the principal products.
7. Italy: a niche within the European market
Italy exported $115.0 million worth of fresh flowers. The Netherlands, Germany, and France were its principal markets. Unlike the global leaders, Italy operates within a dense European network: some products are delivered directly to buyers, while others enter the Dutch trading system.
Its advantage lies in proximity to European demand and a diverse Mediterranean and greenhouse-grown product range. Figures for the entire Italian floriculture and nursery sector should not be confused with cut flower statistics, as the sector includes a substantially broader range of categories.
8. Canada: one market across the border
Canadian exports reached $108.8 million, with almost the entire volume destined for the United States. Proximity to the border creates a short cross-border supply chain, but geography alone does not prove that the country merely re-exports imported products.
Statistics Canada recorded the production and sale of 345.1 million greenhouse-grown cut flowers valued at C$192.3 million in 2023. This confirms the existence of a domestic production base. The Canadian model demonstrates the value of proximity to a major market.
9. Malaysia: a highland tropical product range
Malaysia exported $72.5 million worth of fresh flowers. Japan accounted for more than half of all Malaysian exports, followed by Australia and Singapore. The Cameron Highlands provide cool conditions for chrysanthemums and other flowers, while the tropical climate broadens the product range with orchids and decorative foliage.
The country's competitive advantage is its specialized product range and proximity to Asian buyers. At the same time, Australia and New Zealand impose strict phytosanitary requirements, making market access dependent on certification and precise compliance with protocols.
10. Vietnam: Da Lat and demanding East Asian markets
Vietnam completes the top ten with exports of $71.7 million. Japan received $42.4 million, the Republic of Korea $13.5 million, and Australia $6.1 million. The main production center is Da Lat and Lam Dong Province, where the mild highland climate is suitable for chrysanthemums, roses, lilies, and other crops.
Regional authorities reported 9,898 hectares of flowers and ornamental plants in 2023, with annual output exceeding 4 billion stems. These figures cover a broader scope than export category 060310, but they help explain the production base capable of serving markets with demanding quality standards.
Five export models
Five models of participation in the global market
-
Model 01 International trade and logistics hub NetherlandsHow it works
Production, imports, auctions and direct transactions, consolidation, re-exports, and European distribution.
Primary advantageInfrastructure scale and access to a broad buyer base.
Primary riskDependence on international trade flows and costly infrastructure.
-
Model 02 Large-scale producing exporter ColombiaHow it works
Large-scale production and regular supply programs for the U.S. market.
Primary advantageA broad product range and the ability to assemble large, uniform consignments.
Primary riskConcentration on one market and one principal air corridor.
-
Model 03 Specialized product exporter EcuadorHow it works
High-altitude roses and long-haul shipments to several markets.
Primary advantageRecognized specialization and a more diversified sales geography.
Primary riskComplex multi-route air logistics and high transportation costs.
-
Model 04 Producer supplying through a European hub Kenya and especially EthiopiaHow it works
Air shipment to the Netherlands, followed by sale and distribution of consignments throughout Europe.
Primary advantageAccess to a broad buyer base without maintaining a dedicated sales network in every country.
Primary riskDependence on the hub, air cargo capacity, and EU phytosanitary controls.
-
Model 05 Regional or specialized supplier China, Italy, Canada, Malaysia, VietnamHow it works
Short regional routes, specialized products, or cross-border trade.
Primary advantageMarket proximity, knowledge of local demand, and product specialization.
Primary riskLimited sales geography and phytosanitary barriers in target markets.
How logistics shapes the global flower market
Flowers lose commercial value with every additional hour spent outside a controlled temperature range. Logistics is therefore not a supporting service in this industry, but part of the product itself.
The Latin American corridor connects Bogotá and Quito with Miami and other airports in the United States and Europe. Its advantage is speed; its weakness is seasonal peaks, when growers are simultaneously competing for aircraft capacity, terminal slots, and inspectors. Refrigerated ocean containers are not suitable for every cultivar or supply program, but Colombia's seasonal share of 8% shows that sea freight has established a commercial niche.
In East Africa, flowers move from production clusters to Nairobi or Bole and then to the Netherlands, the United Kingdom, and Gulf countries. Competitiveness here depends on cargo capacity and uninterrupted cooling at least as much as on production costs at the farm.
The Netherlands converts intercontinental flows into a European distribution network. Schiphol, Aalsmeer, digital and auction trading, grading, and a network of international road carriers operate as a single system. Canada benefits from proximity to the United States, while China, Malaysia, and Vietnam form regional supply chains centered on Japan, Korea, Australia, and ASEAN countries.
In every model, the cold chain is critical: the required temperature must be maintained continuously from post-harvest handling to the buyer's warehouse. A failure at any stage reduces the available sales window even when the flight itself arrives on schedule.
Key trade corridors
Bar length corresponds to the value of recorded exports
- Colombia→United States $1,647.6 million
- Netherlands→Germany $1,312.4 million
- Netherlands→United Kingdom $508.0 million
- Ecuador→United States $332.9 million
- Kenya→Netherlands $271.8 million
- Netherlands→Russia $242.0 million
- Ethiopia→Netherlands $175.1 million
- Ecuador→Kazakhstan $129.2 million
- Kenya→United Kingdom $114.4 million
- Canada→United States $108.7 million
- China→Japan $47.7 million
- Vietnam→Japan $42.4 million
- Malaysia→Japan $38.1 million
The corridors represent trade between partner countries, not the literal route taken by an aircraft, truck, or ocean container.
How the market is changing
Direct and digital sales channels are expanding within the Dutch system. In 2024, Royal FloraHolland recorded a 2% increase in direct sales volume and a 5% decline in volume sold through auction clocks. This does not indicate the disappearance of the auction model, but rather a shift in the balance between sales channels.
Ocean freight complements air transport. Colombia's seasonal figure of 8% shipped by sea confirms the commercial use of container programs. No comparable source provides a global share for the ocean transport of fresh flowers.
Phytosanitary controls are becoming stricter. The EU increased the inspection frequency for roses from Kenya and Ethiopia to 25% in May 2024. For exporters, this means stricter requirements for plant protection, documentation, and contingency time.
Limited air cargo capacity is becoming a market risk. Kenya's AFA regulator attributed the decline in national export volume in 2024 partly to the cargo capacity crisis at JKIA and increased demand for air freight amid disruptions in the Red Sea.
Regional supply chains remain a distinct part of the market. The trade patterns of China, Malaysia, Vietnam, and Canada show that not all flower trade passes through global hubs. Proximity to buyers and familiarity with their requirements can compensate for smaller scale.
Conclusions
The Netherlands leads in the recorded export value of fresh cut flowers, but its first-place position is not based on production alone. The country has developed an infrastructure system that integrates imports, domestic production, trading, settlement, consolidation, and European distribution. Colombia ranks second by recorded export value and relies on a substantial domestic production base. Ecuador competes at a smaller scale through its specialization in high-altitude roses and a more diversified geographic reach.
East Africa builds its competitiveness on year-round high-altitude production, but Kenya and especially Ethiopia remain dependent on air freight and European sales channels. The countries in the lower half of the top ten account for smaller export values, but play an important role in specific regions and product categories.
For importers, the practical conclusion is straightforward: flower prices cannot be assessed separately from routing, cargo capacity, phytosanitary clearance, and the cold chain. Cargo Flowers helps integrate these elements into a single supply chain, from the farm to the destination market.
FAQ
Which country is the largest exporter of cut flowers?
The Netherlands. In the comparable WITS/UN Comtrade ranking for 2023, its exports of fresh cut flowers totaled $4.647 billion, representing 47.46% of the combined national entries excluding the EU aggregate. Its leadership reflects both domestic production and the country's role as an international center for importing, trading, consolidating, and distributing flower consignments.
Is the Netherlands the world's largest flower producer?
This ranking does not support that conclusion because it compares export value rather than production volume. The Netherlands has a substantial greenhouse sector, but it also imports flowers from East Africa and Latin America and then distributes them throughout Europe. The sources used do not provide a comparable global production table.
Which countries supply the most flowers to the United States?
Among the countries in the ranking, Colombia is the leading supplier to the U.S. market. In 2023, it exported $1.648 billion worth of fresh cut flowers to the United States. Ecuador was the second major Latin American supplier, with exports of $332.9 million. Most flower imports transported by air from these countries pass through Miami International Airport before being distributed throughout the United States.
Which countries supply the most flowers to Europe?
The Netherlands is Europe's principal distribution hub, while Kenya, Ethiopia, Ecuador, and Colombia are among the most prominent external production bases. In 2023, Kenya exported $271.8 million worth of fresh flowers to the Netherlands, while Ethiopia exported $175.1 million. Some of these products are subsequently resold and delivered to buyers in other European countries.
Why is Ecuador known for its roses?
Ecuadorian roses are grown in high-altitude regions with cool nights and intense sunlight. The industry associates these conditions with long stems, large flower heads, and a broad range of cultivars. Ecuador trails Colombia in total export value, but its specialization in high-altitude roses and more diversified sales geography distinguish its export model.
How does Kenya export flowers to Europe?
Flowers from Naivasha and other areas of Central Kenya are transported under refrigerated conditions to Nairobi Airport and then shipped on cargo flights. The Netherlands is the largest destination, where consignments are sold and distributed throughout Europe. The United Kingdom is another significant direct market. Air cargo capacity and the speed of phytosanitary inspections directly affect the available sales window.
How does Colombia's export model differ from Ecuador's?
Colombia operates at a larger scale and is more heavily concentrated on a single market, with nearly 80% of its export value coming from the United States. Ecuador exports approximately half as much, specializes in high-altitude roses, and distributes sales among the United States, Kazakhstan, the Netherlands, Italy, and Canada. Both countries depend on air freight, but manage different patterns of geographic demand.
Why does the ranking use 2023 data instead of 2024?
Ethiopia and several other reporting countries are absent from the WITS table for 2024, which would make the global top ten incomplete. The year 2023 is the latest verified period with a comparable group of leading exporters. Available figures for 2024 can be published separately without combining them with the main ranking.
Sources
- World Bank WITS / UN Comtrade. Fresh cut flowers and buds exports by country, 2023.
- United Nations Statistics Division. HS 2012, heading 0603.
- Royal FloraHolland. Annual Report 2024.
- Royal Schiphol Group. Perishables & Flowers.
- CBS. Dutch Trade in Facts and Figures 2025: International trade in goods.
- ProColombia. Valentine season flower logistics, 2024.
- Miami International Airport. Flower imports before Valentine’s Day, 2025.
- Banco Central del Ecuador. Memoria 2023, statistical annexes.
- Pro Ecuador. Record flower shipments for Valentine 2024.
- Agriculture and Food Authority of Kenya. Yearbook of Statistics 2024.
- European Union. Implementing Regulation (EU) 2026/1101, current minimum inspection frequencies.
- Ethiopian Cargo. Addis Ababa Hub.
- Statistics Canada. Production and sale of greenhouse flowers and plants.
- National Forestry and Grassland Administration of China. Flower imports and exports, 2023.
- Department of Agriculture Malaysia. Phytosanitary requirements for horticultural exports, 2024.
- Lâm Đồng Province. Review of fresh cut flower production and exports, 2024.
- Yunnan Agriculture Department. Fresh cut flower production and exports, 2023.
- Royal FloraHolland. Floriculture transport.
- WITS / UN Comtrade. Exports by destination, 2023: Netherlands, Colombia, Ecuador, Kenya, Ethiopia, China, Italy, Canada, Malaysia, Vietnam.
- European Union. Implementing Regulation 2022/2389, consolidated version from 1 May 2024.
